
Dynamic Support & Resistance Pro
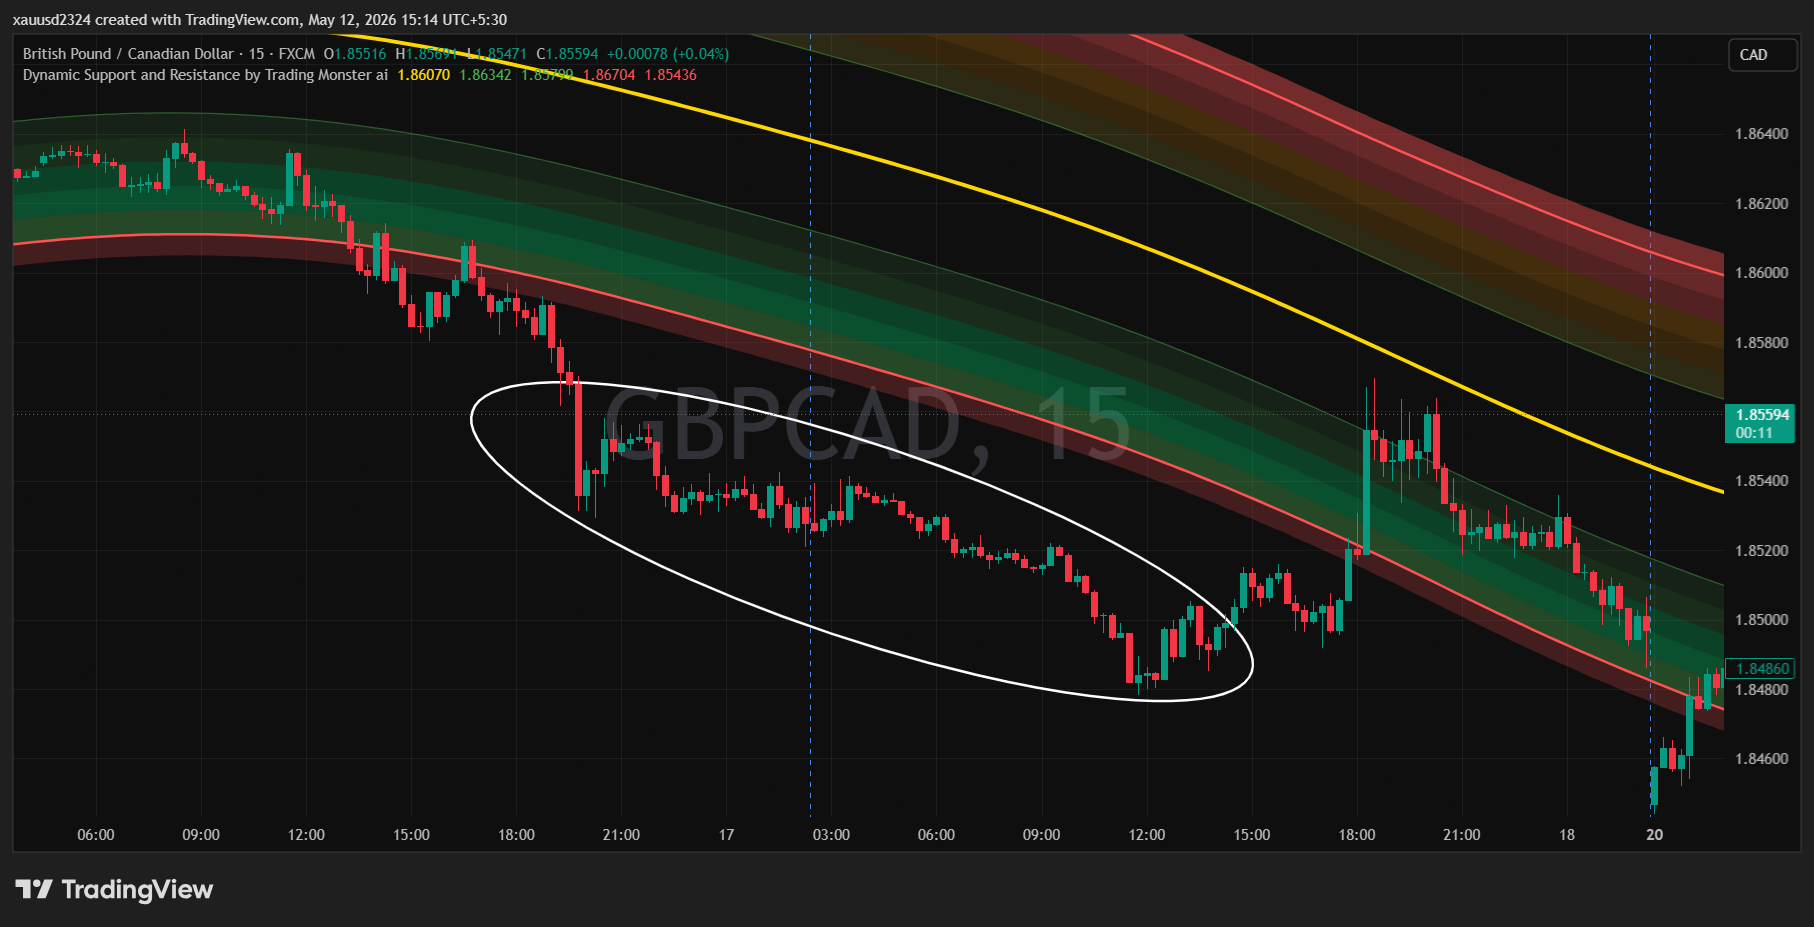
The Dynamic Support & Resistance Pro is a volatility-adjusted indicator that automatically draws dynamic support and resistance zones on your chart. Unlike static levels, these zones adapt in real time to current market conditions. It displays two colored bands — an upper band (resistance) and a lower band (support) — each containing an inner zone and an outer zone. It is designed to help traders identify high-probability mean reversion and reversal trade setups.
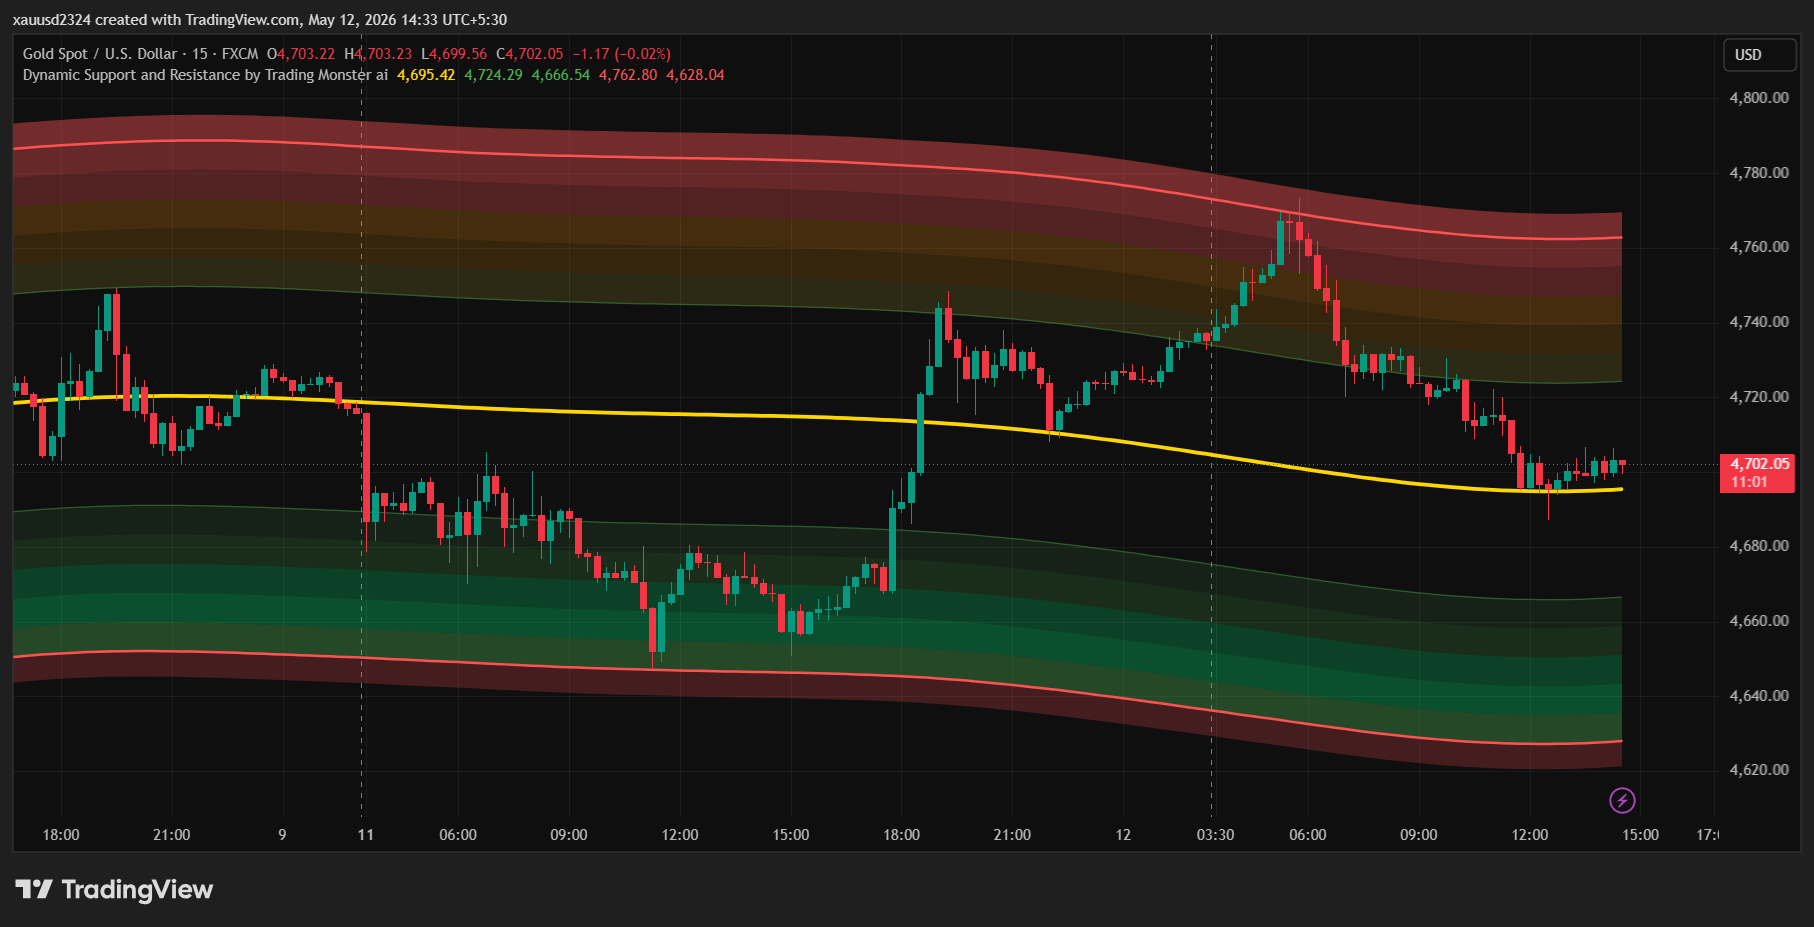
DYNAMIC SUPPORT & RESISTANCE TUTORIAL
Rejection Zone Identification
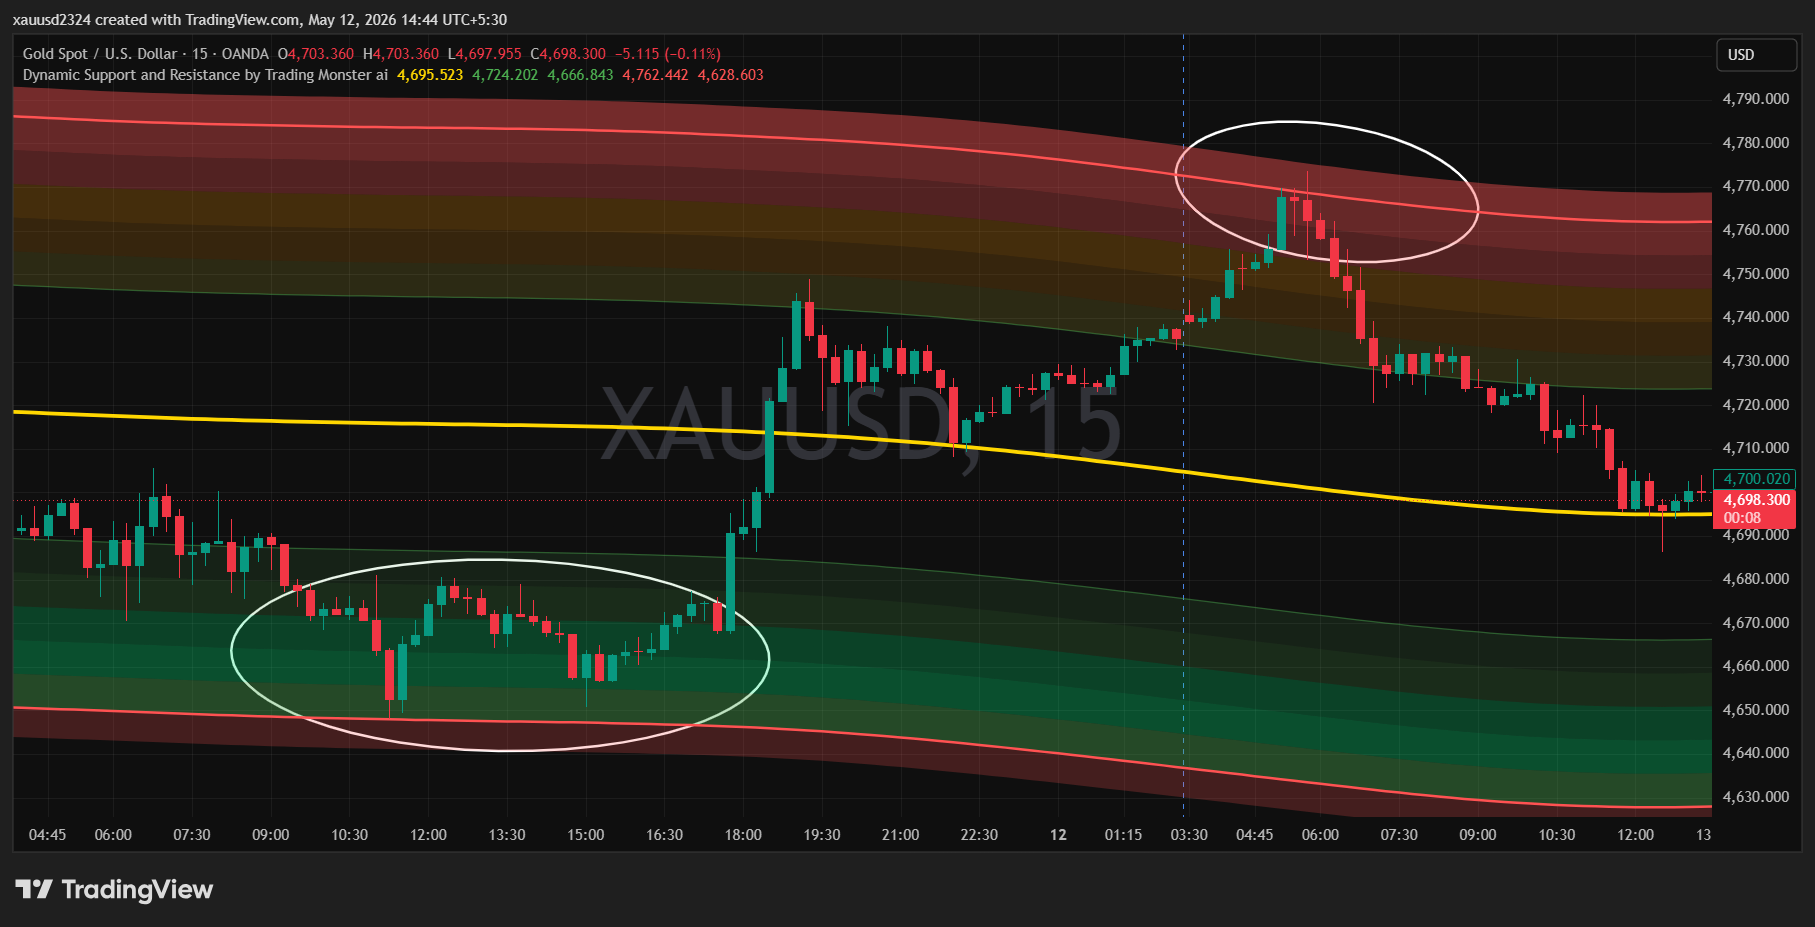
Spot high-probability reversal areas where institutional reactions may occur.
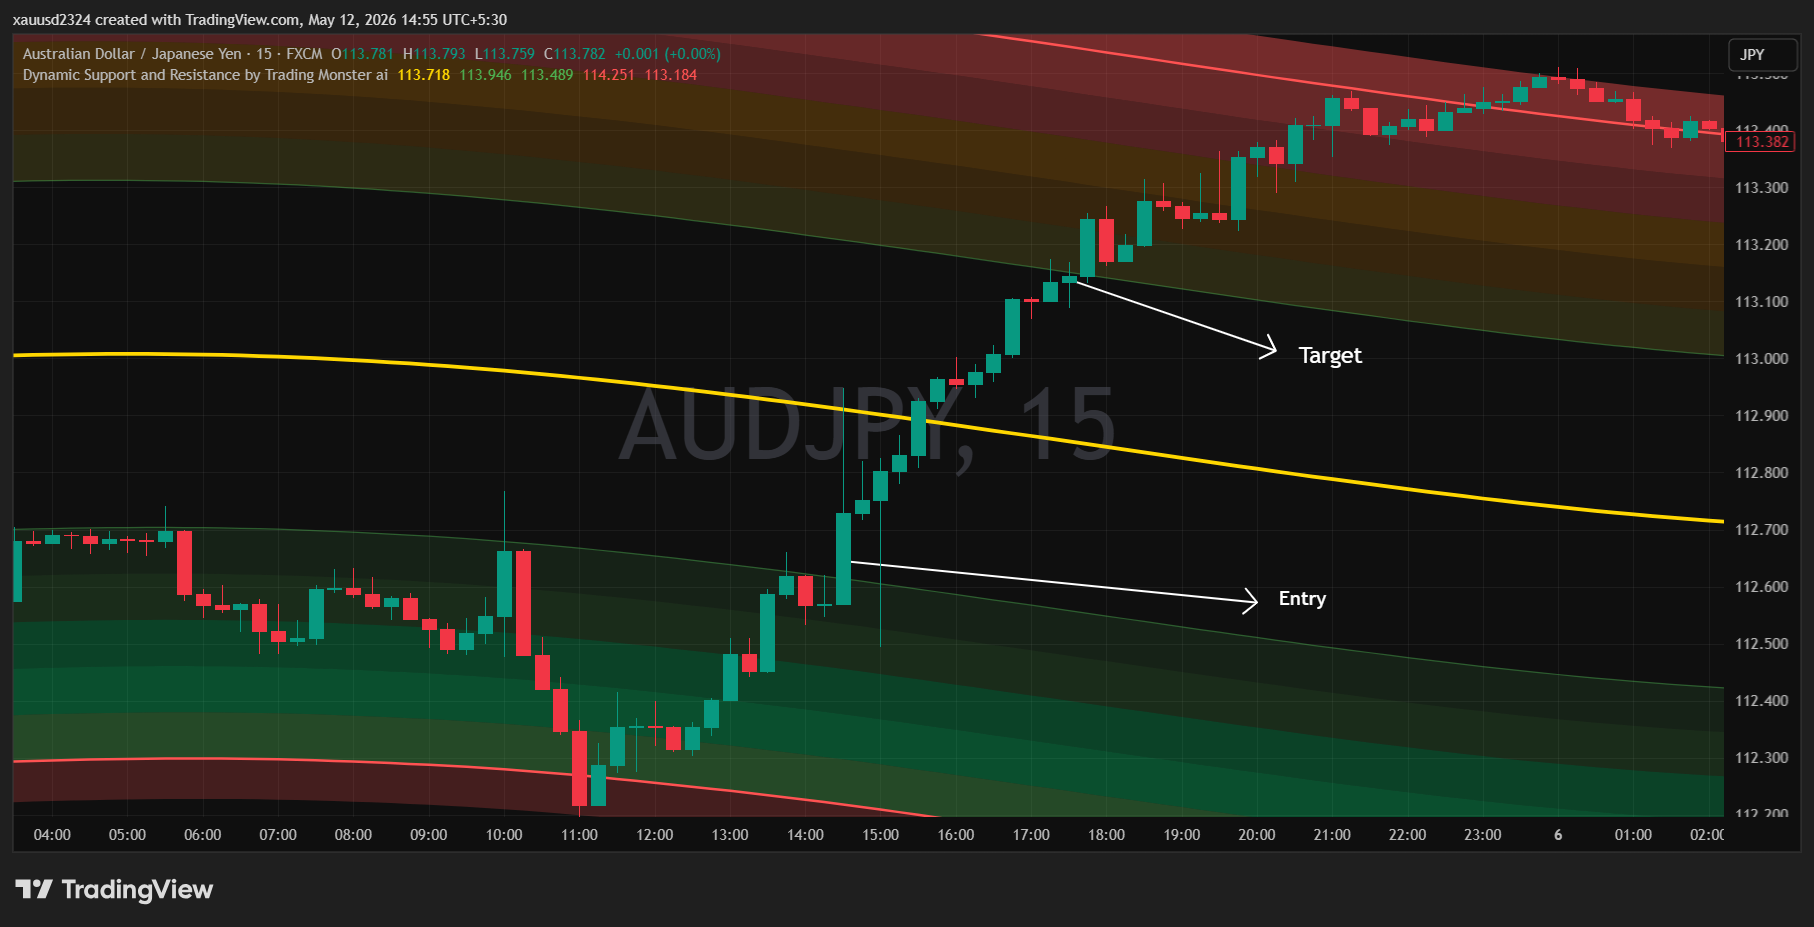
Buy Trade
High Probability Long Entry
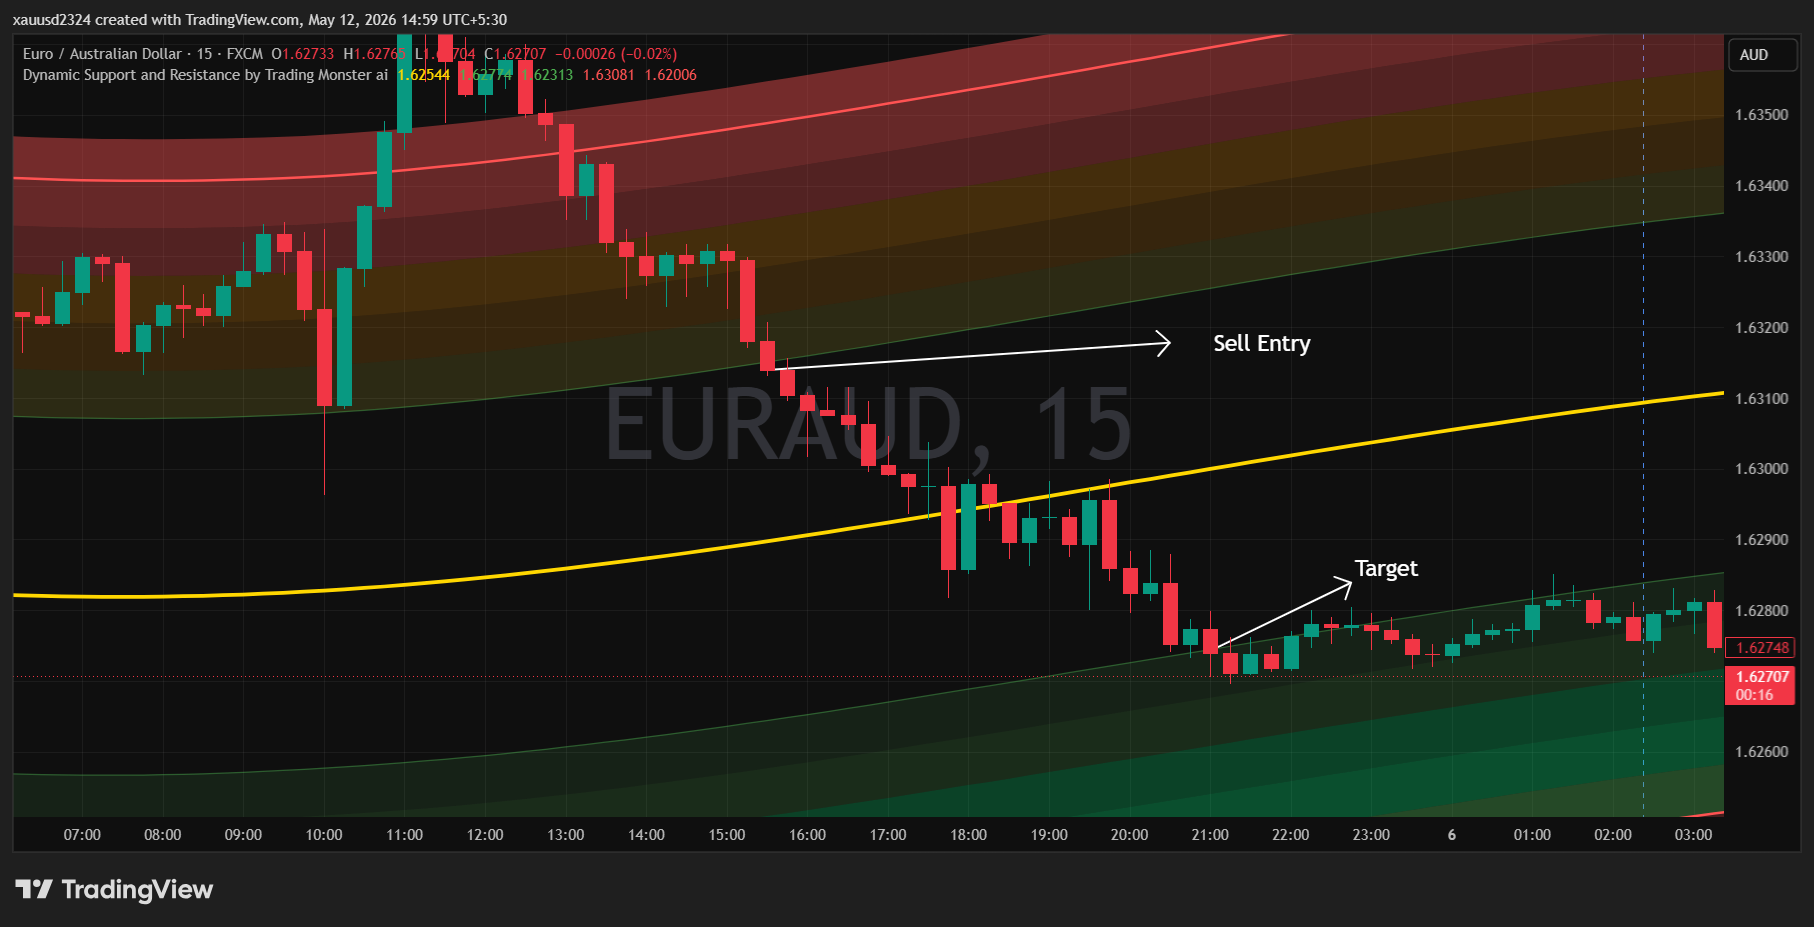
Sell Trade
High Probability Short Entry
NO Trade
We avoid entry during high volatility
Benefits of Dynamic Support & Resistance
- Identify High-Probability Entry Zones
- Improves Breakout Confirmation
- Reduces Manual Chart Work
- Works Across All Markets
Core Features
Everything you need to trade like a professional.
Volatility Adjusted Zones
Zones automatically expand during high volatility and contract during low volatility to ensure relevance.
Inner & Outer Zones
Identifies key reversal areas (inner zones) and extreme excursion points (outer zones).
Mean Line
A central baseline (yellow line) that acts as an equilibrium point and initial profit target.
15-Minute Optimization
Specifically calibrated for M15 intraday trading and scalping.
Trading Workflow & Rules
Buy Rules
- Price must reach the lower inner zone.
- Price must spend time at the zone (2-3 candles forming).
- A strong bullish breakout candle must close above the lower inner zone.
Sell Rules
- Price must reach the upper inner zone.
- Price must spend time at the zone (2-3 candles forming).
- A strong bearish breakout candle must close below the upper inner zone.
No Trade
- !Avoid the first re-entry after an extended breakout.
- !Do not trade in the middle of the range near the mean line.
- !Expanded zones during news events indicate mean reversion is lower probability.